The challenge: modern phones randomize their MAC addresses constantly.
That makes traditional device tracking impossible — by design, for privacy. So instead of tracking which device is approaching, WiSpyAlert detects approach patterns: the characteristic change in signal strength when any device moves toward your home. It's the same category of ambient sensing ADT just paid $170M to acquire.
What you're about to see is a walkthrough using actual data captured by a live WiSpyAlert unit — every screenshot is the real interface. Watch how tens of thousands of signals get filtered down to just the events that matter.
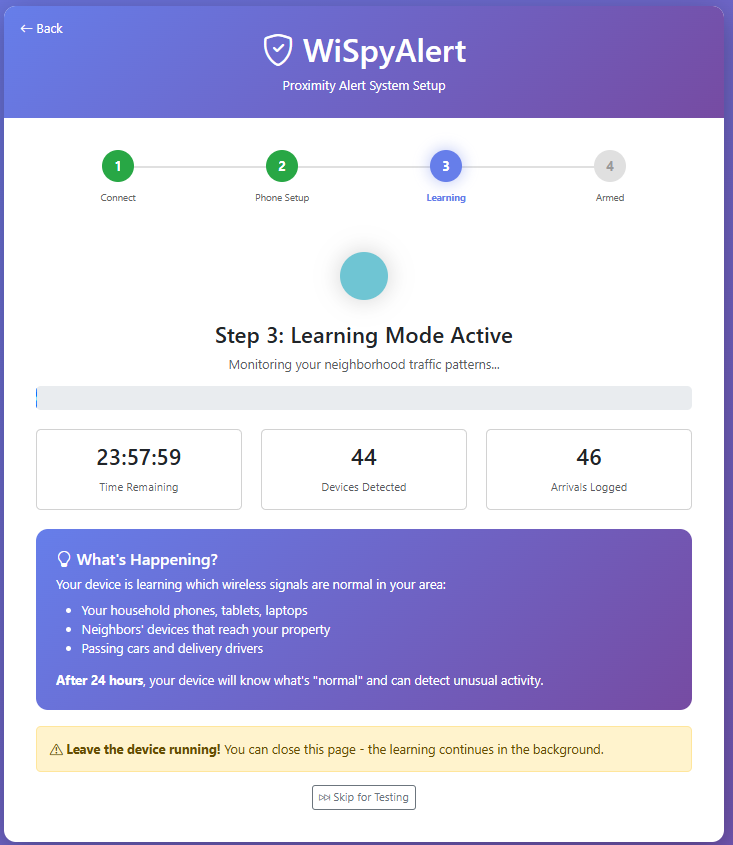
Once installed, WiSpyAlert enters a 24-hour learning period. During this time, the device continuously scans for WiFi and Bluetooth signals from every device in range — your household electronics, your neighbors' devices, passing cars, pedestrians, and delivery drivers. The screen shows time remaining and the number of devices detected, updating every 30 seconds. This learning phase builds a complete picture of your RF environment.
After learning completes, you can review what was captured. In this example: 27,406 total events from 3,098 unique devices over 24 hours — and 9 household devices identified for the ignore list. The chart visualizes signal strength over time, with filters to focus on specific ranges. Here we're viewing only strong signals: just 1,741 of the 27,406 events qualify. This demonstrates a key insight — most detected signals are distant (out on the street) and automatically filtered as non-threats.
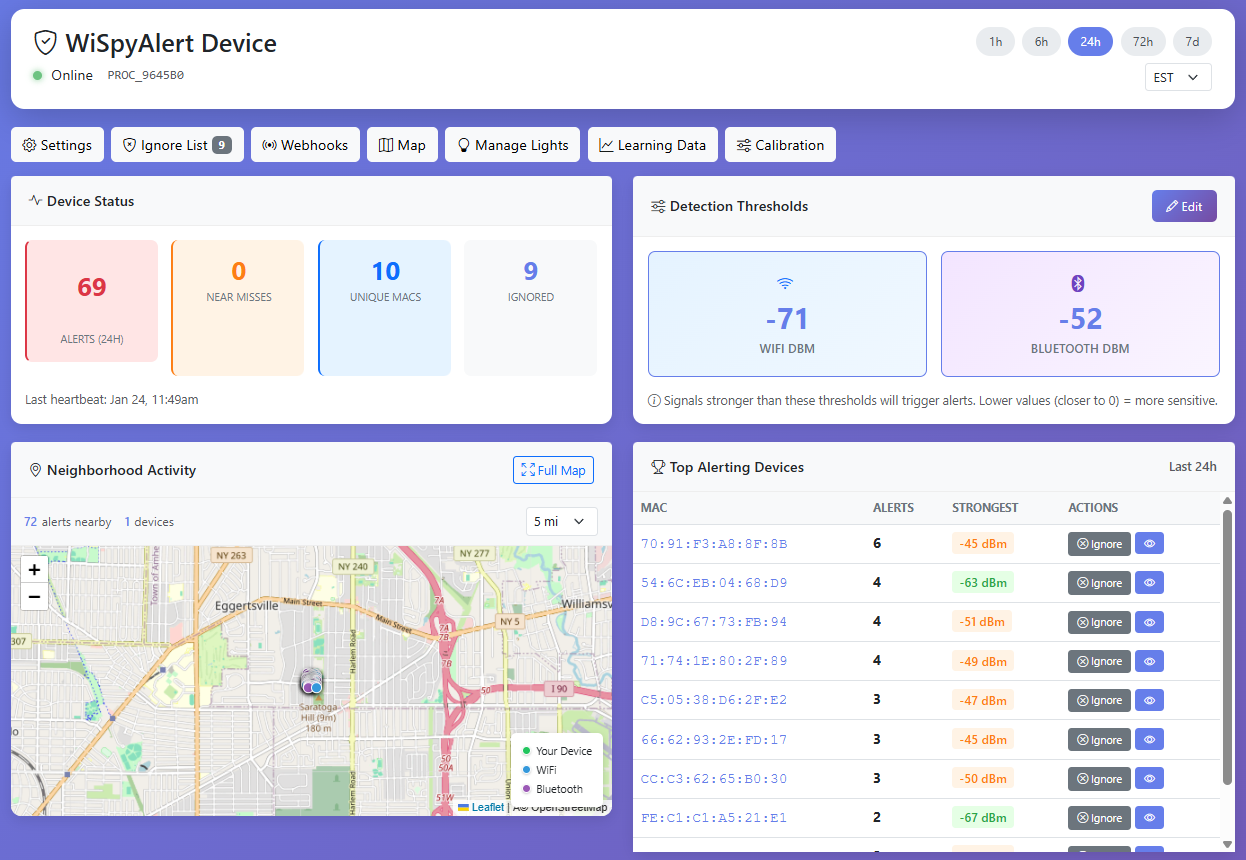
The device dashboard is your control center. From here you can access Settings, manage your Ignore List, configure Webhooks for smart home integration, view the neighborhood Map, control Manage Lights for automatic responses, review Learning Data, and enter Calibration mode. The Calibration tool is where you'll fine-tune your alert thresholds to match your specific property.
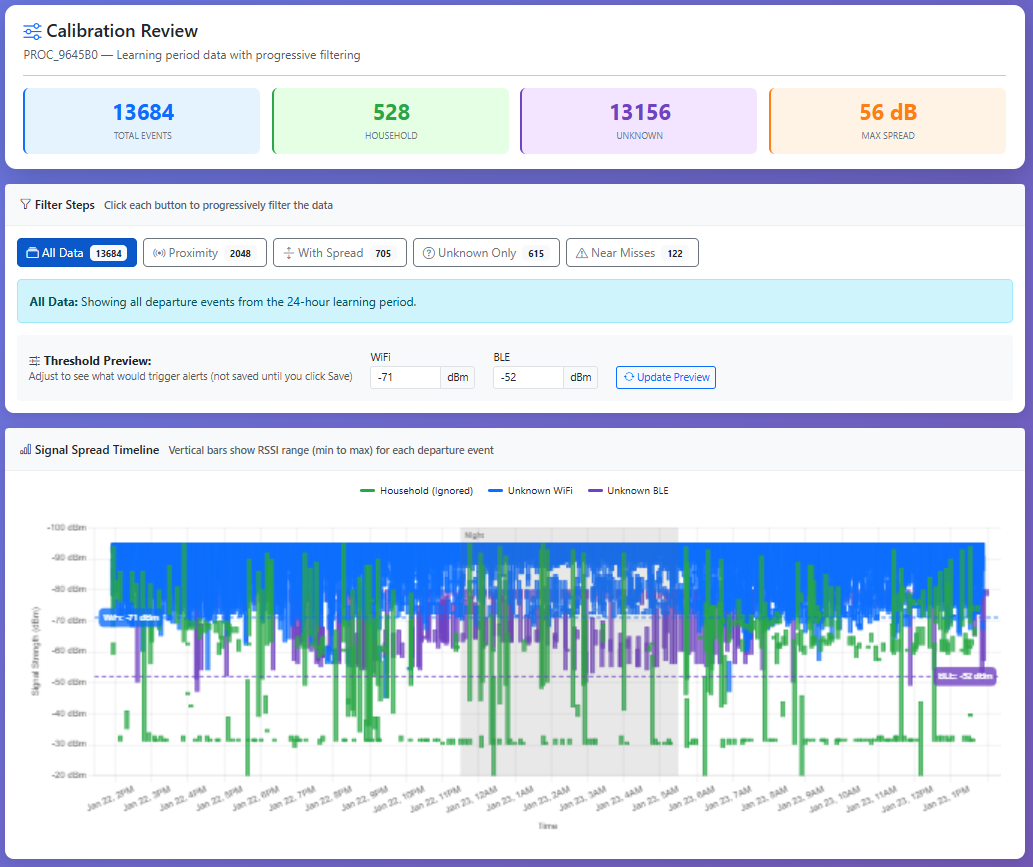
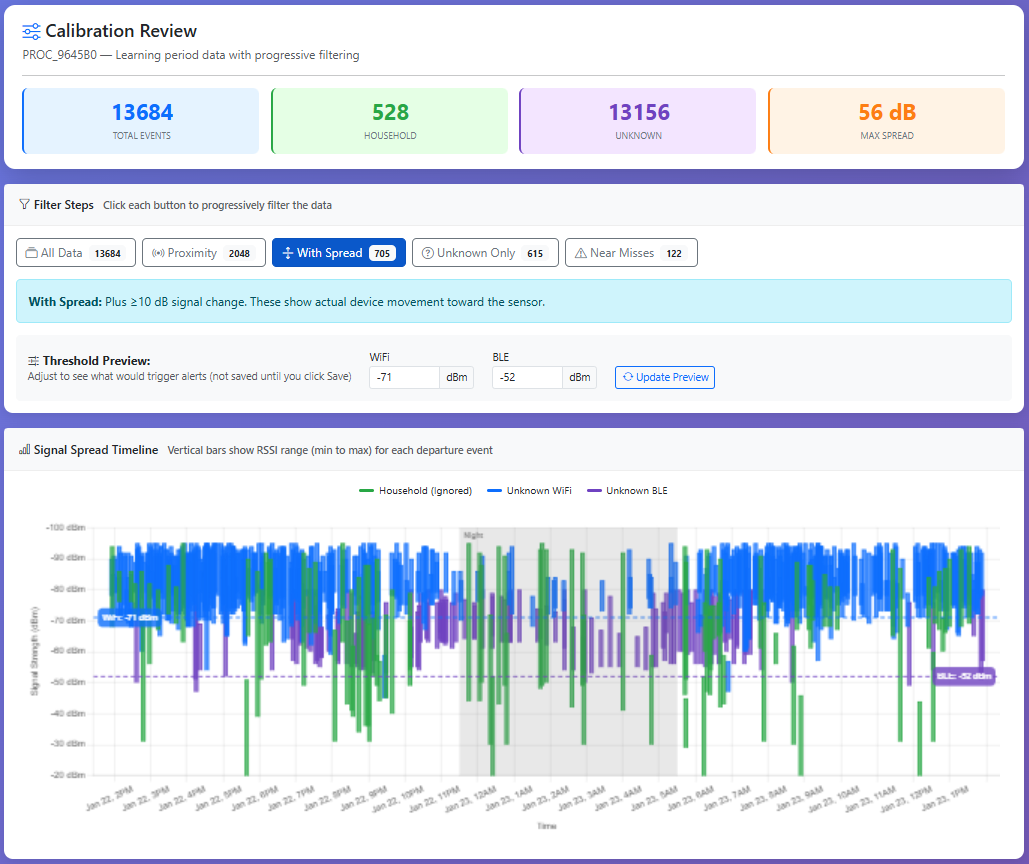
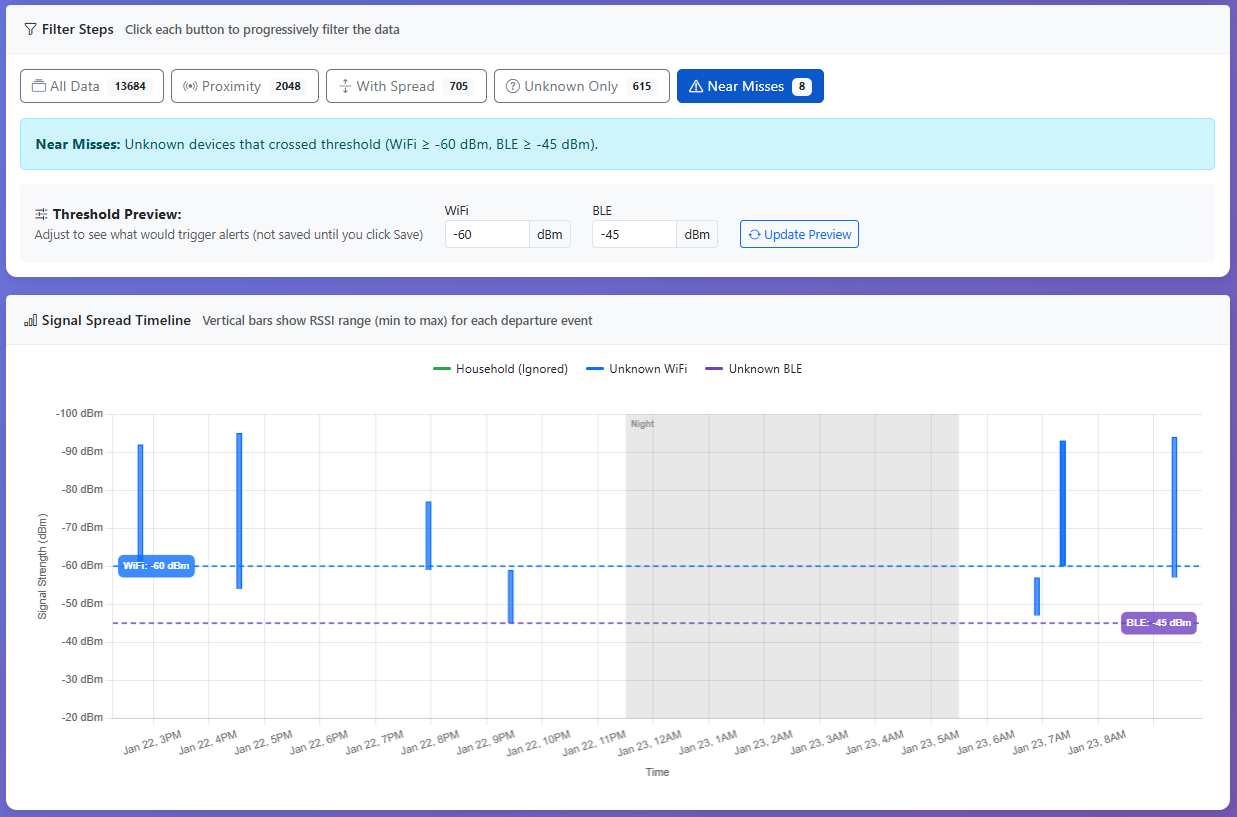
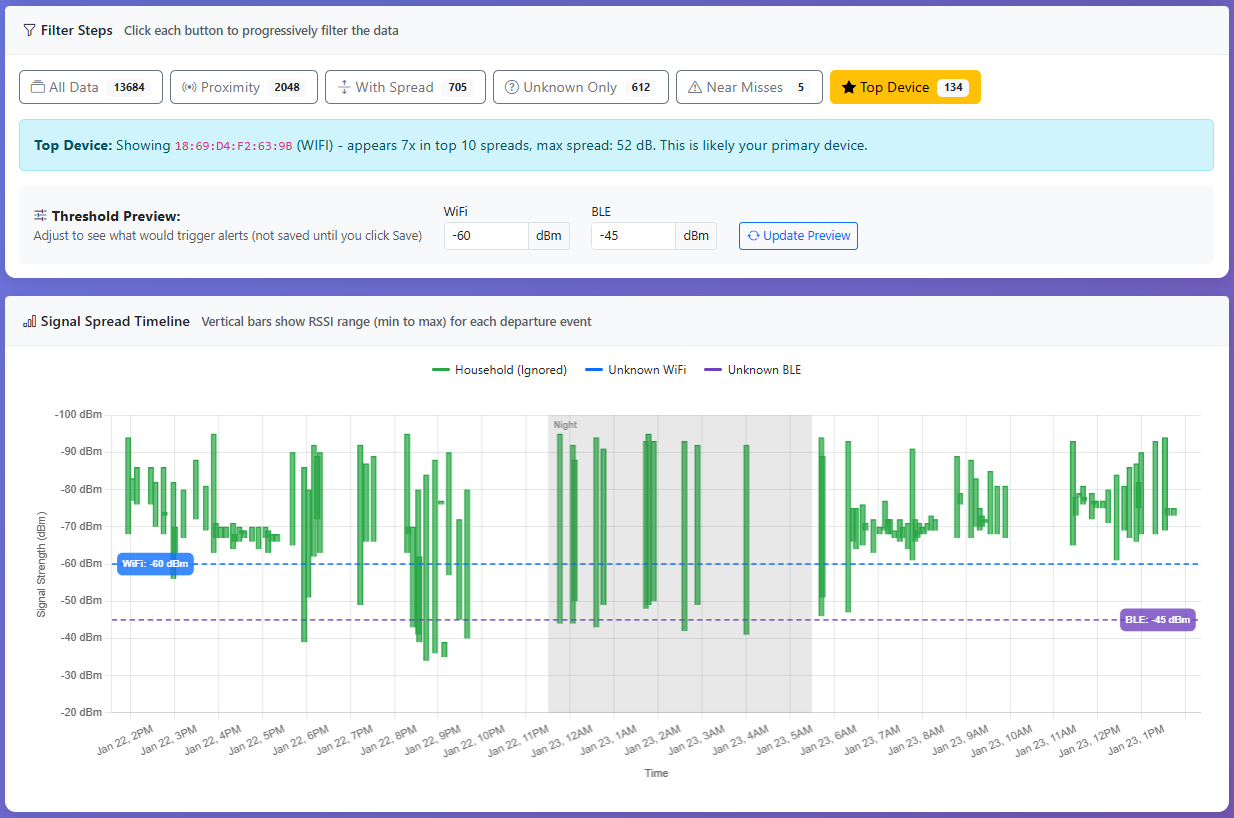
The Calibration Review starts by showing all departure events captured during learning. Each vertical bar represents a device session — spanning from weakest signal (top) to strongest signal (bottom) detected during that session. Gray shaded areas indicate nighttime hours (11pm–5am). This is real data — thousands of WiFi and Bluetooth signals detected over 24 hours.
With all data visible, the chart appears dense with overlapping bars. The blue and purple dashed lines show the WiFi and BLE alert thresholds. Events that cross below these lines (stronger signal) would trigger alerts. The filter buttons at the top show counts — watch how these numbers drop as we apply each filter.
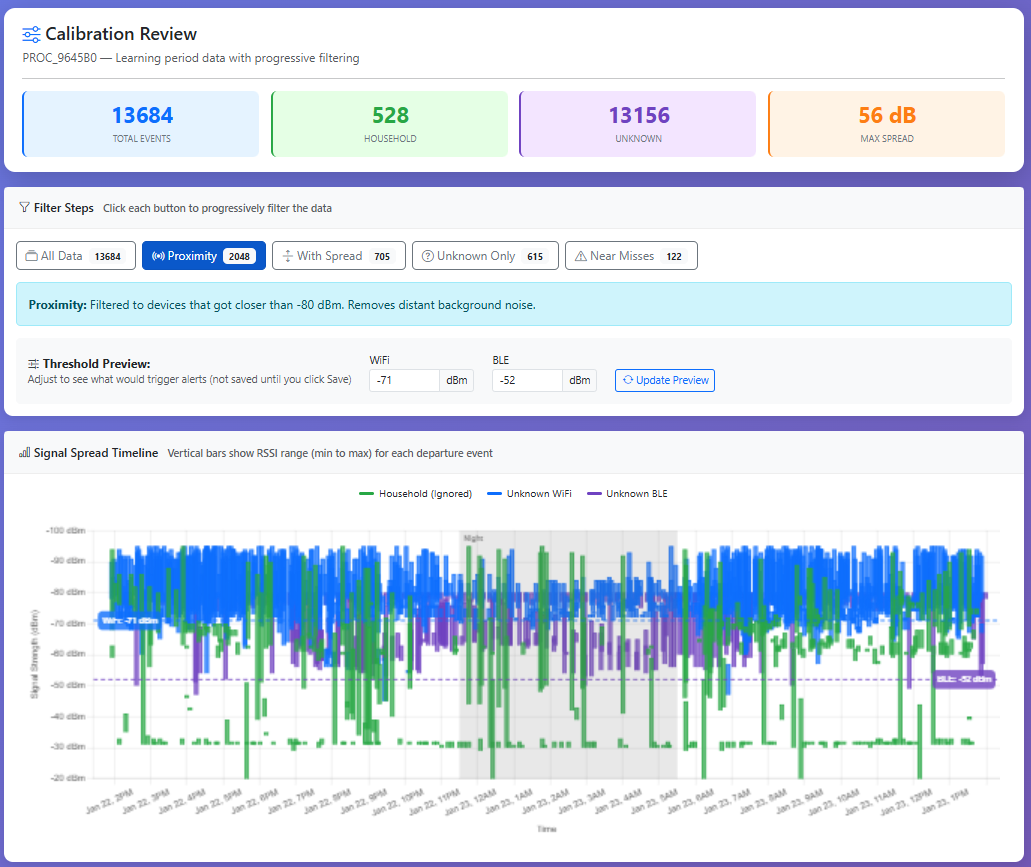
The Proximity filter removes devices that never got closer than -80 dBm. These are distant signals from neighbors, cars passing on the street, or devices detected but never approached. This single filter often eliminates 70-80% of all events, leaving only devices that actually got somewhat close to the sensor.
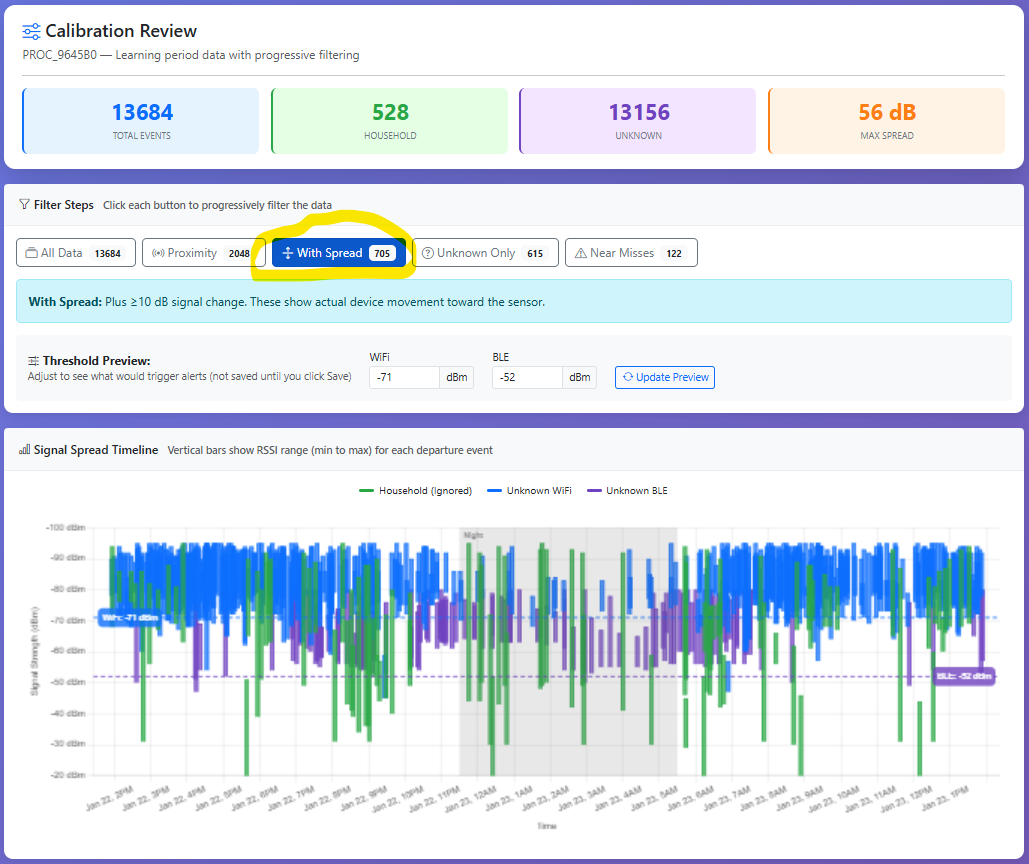
The "With Spread" filter keeps only events where the signal changed by at least 10 dB during the session. A device at constant distance (like a neighbor's always-on device) has zero spread. A device that approaches shows increasing signal strength — that's the spread. This is how WiSpyAlert detects actual movement toward your home.
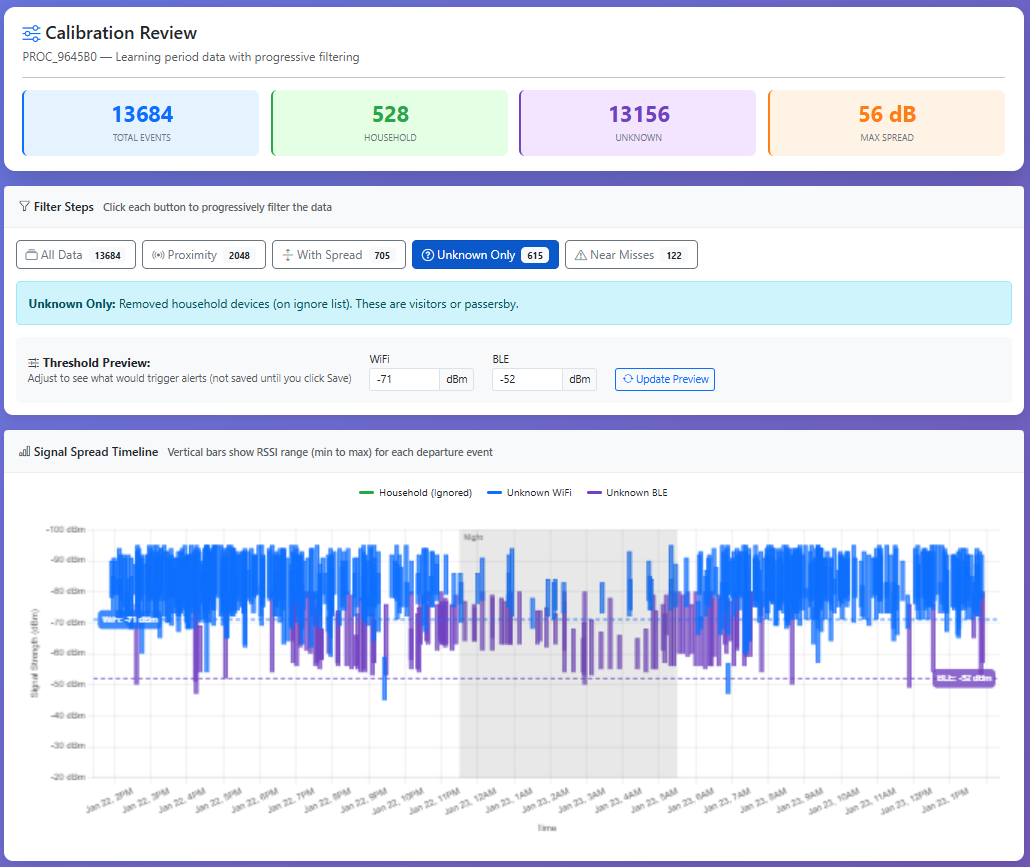
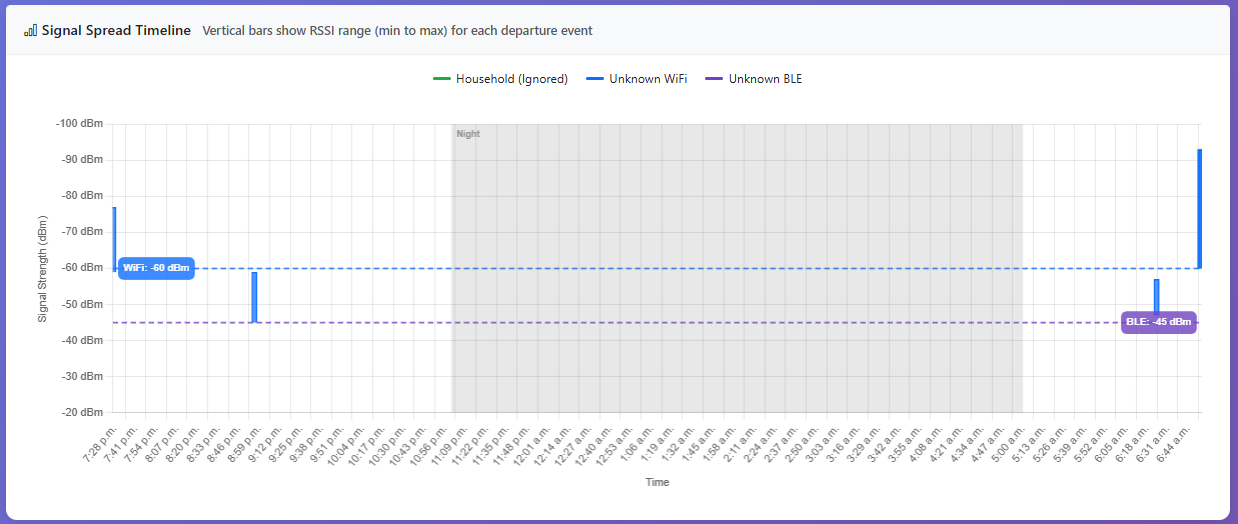
Now we remove devices on the ignore list — household devices identified during setup. What remains are unknown devices: visitors, delivery drivers, and anyone else who approached during learning. The green bars (household devices) disappear, leaving only blue (WiFi) and purple (BLE) unknown devices.
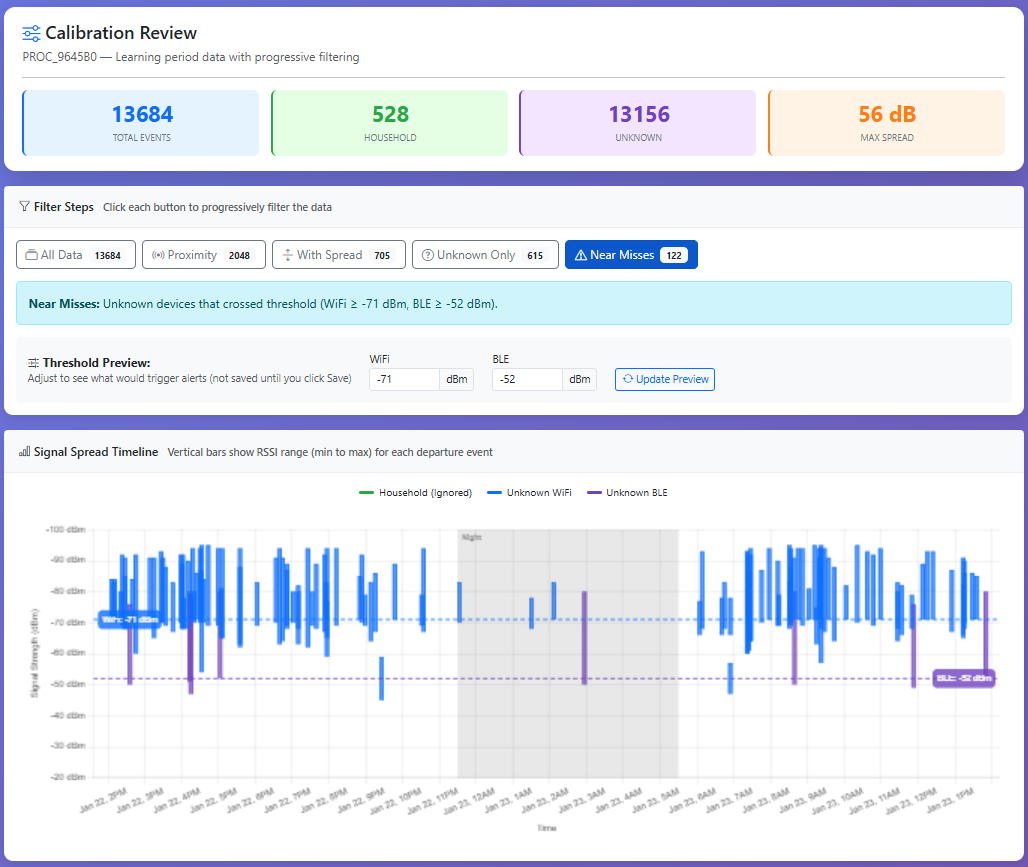
The Near Misses filter shows unknown devices that actually crossed the alert threshold. These events would have triggered real alerts. This is the key insight: out of thousands of initial signals, WiSpyAlert intelligently filters down to just the events that matter — unknown devices that actually approached your home.
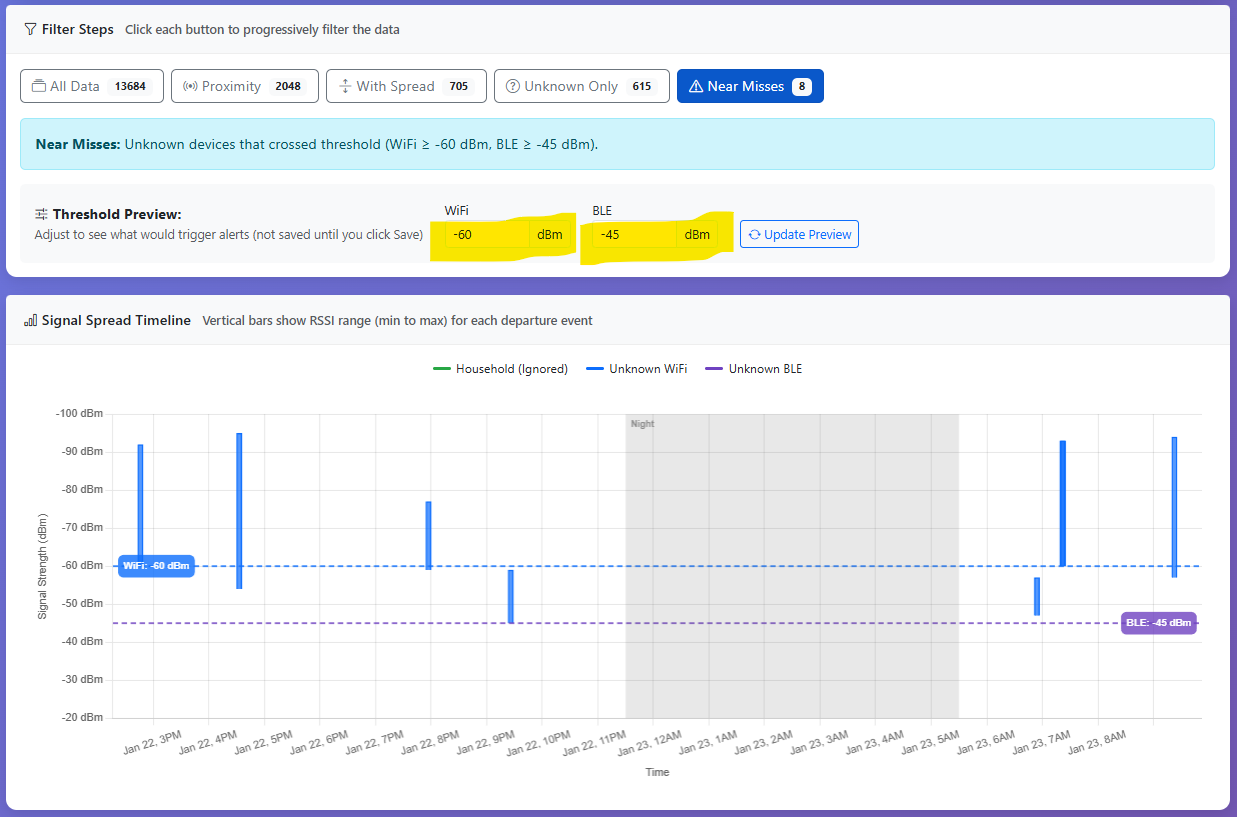
The threshold controls let you experiment with different sensitivity levels. The WiFi threshold (blue line) and BLE threshold (purple line) adjust independently. The preview updates in real-time showing how many events would trigger at each setting. More negative = device must get closer. Less negative = alerts from farther away.
The goal is finding thresholds that catch real visitors while ignoring passersby. Looking at near miss times helps — do they match actual visitor times? A near miss at 3am with no expected visitors suggests the threshold may be too sensitive. Every home is different, and WiSpyAlert lets you tune it perfectly.
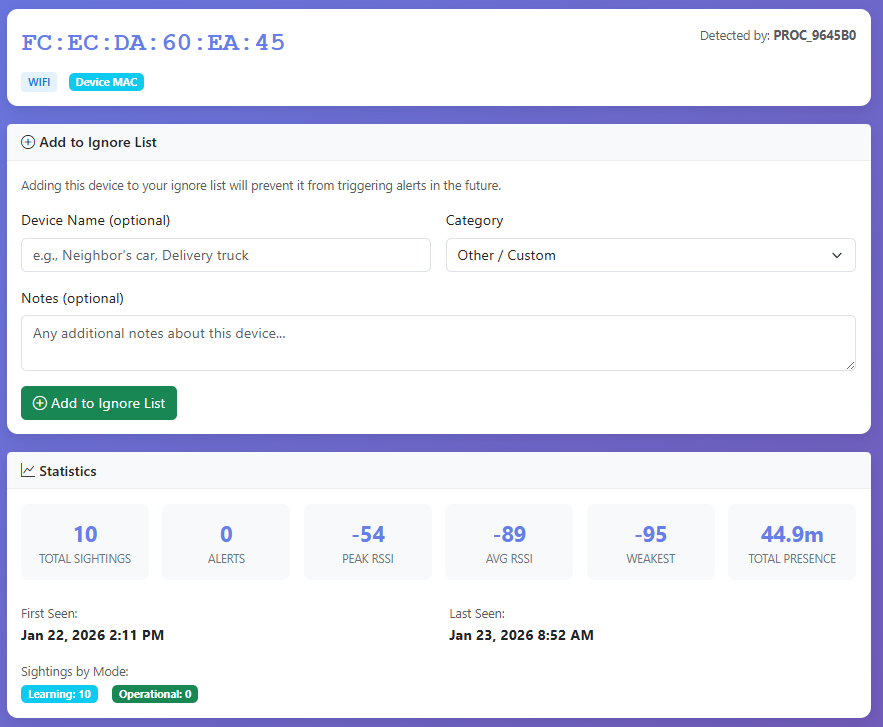
Click any bar on the chart to learn more about that specific device. At this point, we've narrowed thousands of data points down to just a few devices that behaved like potential threats. But we don't want false alerts. This summary screen shows everything about the device during the 24-hour learning period: seen 10 times, peak signal strength of -54 dBm, but typically around -89 dBm, and present for a total of 45 minutes. If you determine this device should be ignored, click the "Add to Ignore List" button to prevent future alerts from this device.
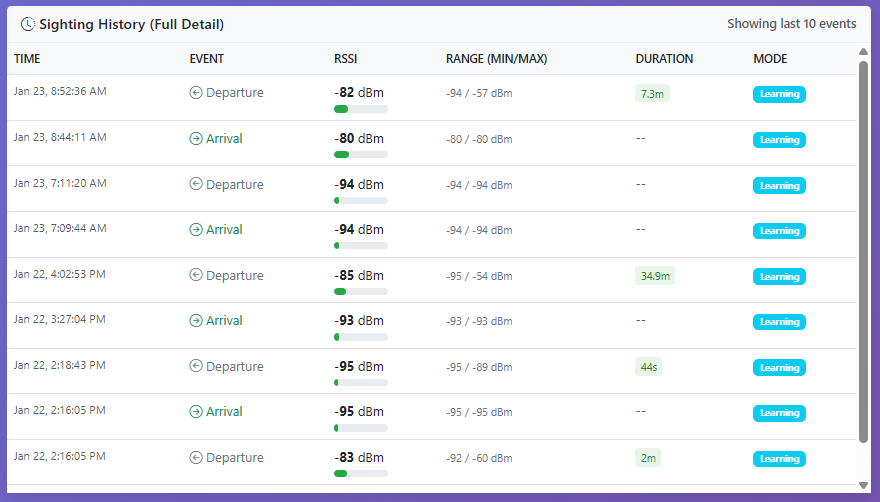
Drill even deeper to see each of the 10 individual events. When exactly was this device seen? At what signal strength? For how long each time? This level of detail lets you correlate detections with real-world events — was that 2pm detection when the mail carrier arrived? Understanding the pattern helps you fine-tune your thresholds with confidence.
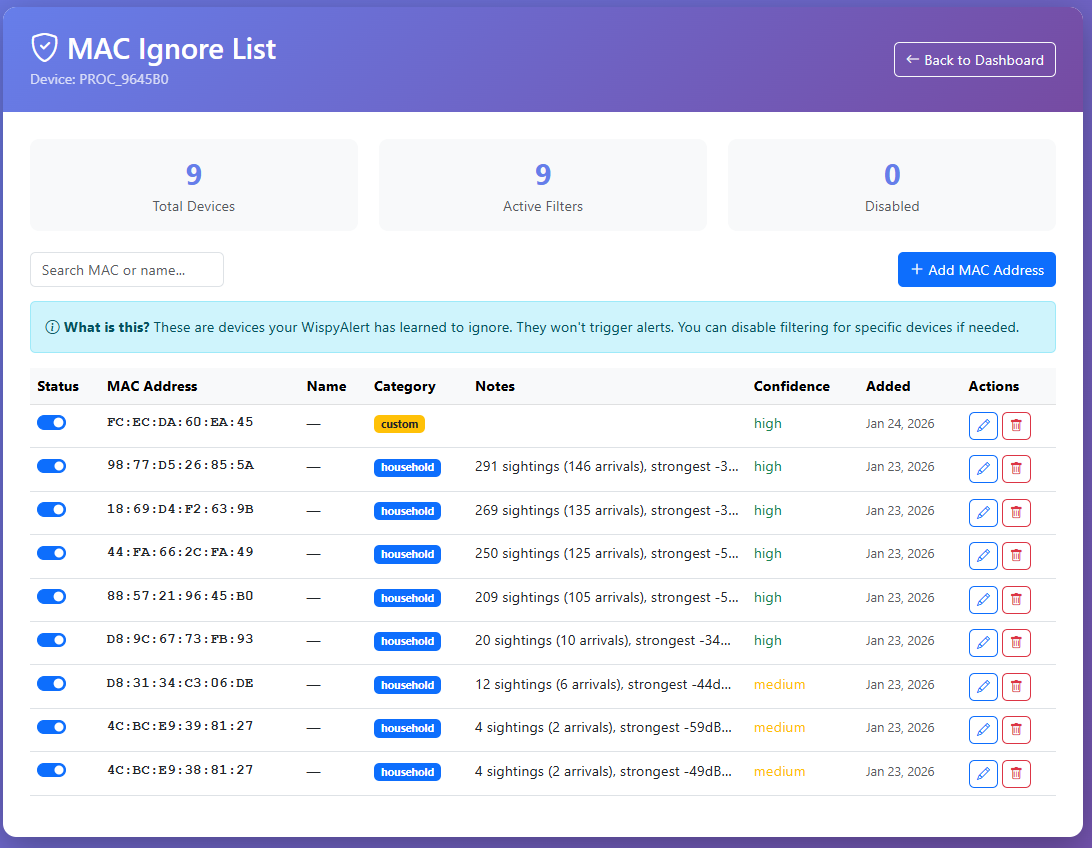
After the 24-hour learning period, WiSpyAlert automatically adds obvious household devices to the MAC Ignore List — we don't want alerts from your own devices. You can also manually add devices, like we just did by clicking "Add to Ignore List" in the drill-down screen. The Notes column explains why each device was added — the system's reasoning for why this MAC should be ignored. Important: it's best to let thresholds screen most devices rather than adding them to the ignore list. Each ignored MAC must be checked against every detection, which adds processing overhead. If your threshold is set to -45 dBm, there's no need to ignore a device that never got closer than -50 dBm — it would never trigger an alert anyway.
This screen shows what happens as you adjust the WiFi and BLE thresholds. As you lower the thresholds (making them more negative), fewer bars appear on the chart — only devices that got very close will qualify. The goal is finding the sweet spot where only devices actually approaching your house will trigger an alert. This screening tool lets you tailor the device for your specific property and comfort level.
The "Top Device" button isolates what is most likely one of your phones — the device with the most significant approach patterns. The long vertical bars show the device traveling from far away to very close, crossing well below the alert threshold. This is exactly what an approaching visitor looks like. Since this is your phone (and on the ignore list), it won't trigger alerts. But this view proves the system works: it correctly detects when devices approach from a distance and enter your home.
§ NEXT
This is what's running inside the sensor. Get one on your block.
WiSpyAlert sees what's approaching before cameras or motion sensors can. Each sensor contributes to a shared map of unknown wireless activity — without video, without identities, without surveillance.
Claim Your Block $49.95